Region in Review – Counting the cost of 2020 to Greater Vancouver businesses
Greater Vancouver Board of Trade President & CEO Bridgitte Anderson examines the findings released in our annual Region in Review report.
It has been a little over a year since B.C. recorded its first case of COVID-19. Back then, the challenges that have come to define our new "normal" would have been almost unthinkable for many Greater Vancouver Businesses.
Thankfully, the ongoing application of effective vaccines means there is finally light at the end of the tunnel, however there can be no doubt that this global pandemic has left an indelible impact on our region's economy.
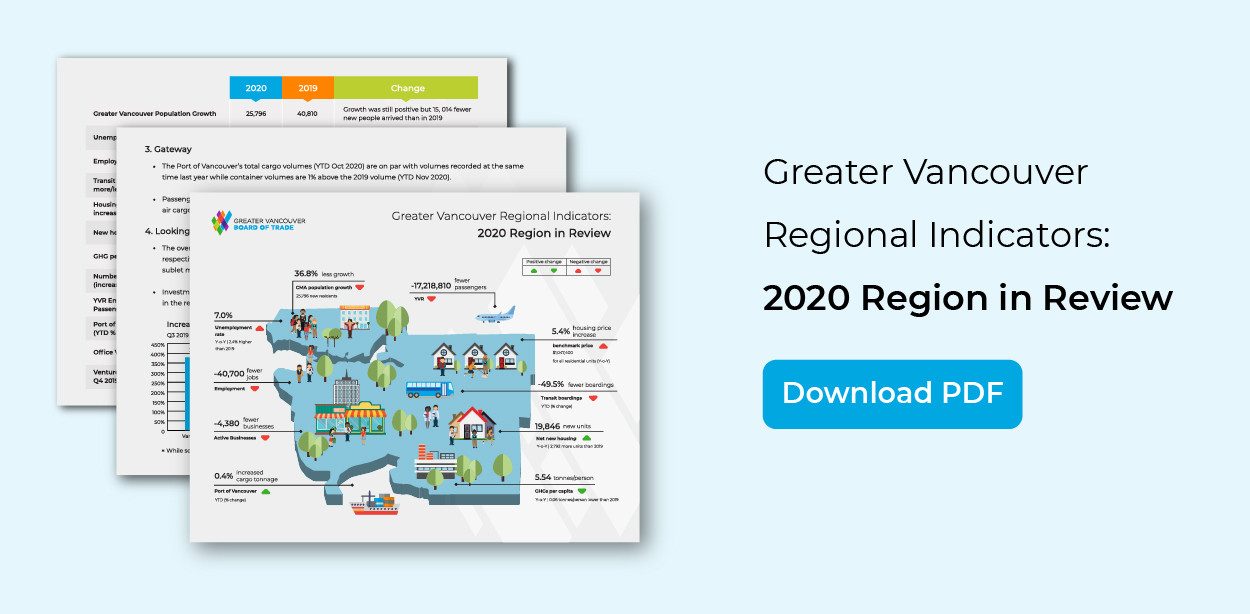
It will perhaps be years before we fully understand the toll that this has taken, but at the Greater Vancouver Board of Trade we're attempting to count the cost of COVID-19 through our Region in Review report, an annual undertaking that provides a snapshot of our city's economic wellbeing.
A challenging year for businesses
Unsurprisingly 2020 was a challenging year for Greater Vancouver. There were 4,380 fewer active businesses open in Greater Vancouver. That impact was felt in the jobs market too with the region losing 40,700 positions, roles that despite green shoots of economic recovery, are taking longer to return than Canada's other major cities.
The pandemic caused a ripple effect that can be felt throughout our region's economy. Closed borders prompted a stark drop in travel and tourism, industries that are a vital component of our region's economy, particularly during the summer months. That impact can be seen in the passenger traffic at YVR, which is down a staggering 17.2 million passengers or 85.3% compared to 2019.
Likewise, stay at home orders and social distancing decimated the hospitality industries while a dip in population growth hampered the influx of people that has become a common part of life in Greater Vancouver.
One bright spot was the ability of our port and terminals, which showcased their resiliency and ensured that supply chains remained open. Impressively, overall cargo columns actually increased year over year. This shows that Canada continues to be a trading nation and our future is bright.
The affordability challenge
Despite the economic hardships that our region experienced over the past month, the pandemic has had little impact on Greater Vancouver's growing affordability crisis.
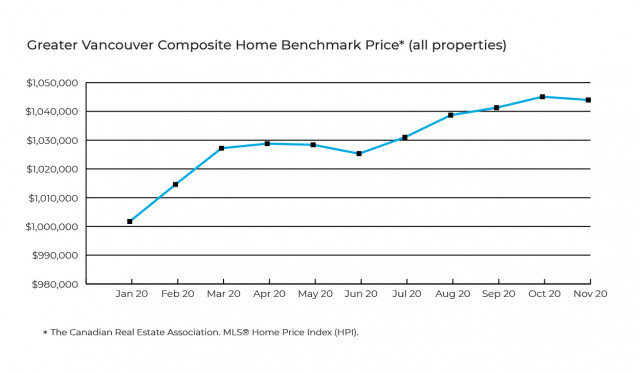
Rather than decreasing in line with rising unemployment, housing prices actually increased. At $1,047,400, Greater Vancouver's benchmark price for all residential units rose 5.4% in 2020, cementing its spot as the highest in Canada.
Though the construction industry was able to operate throughout the pandemic supply is still struggling to meet demand in Greater Vancouver. According to our report, the region gained 19,846 new housing units in 2020, just 2,792 more units compared to the same period in 2019.
In order to thrive as a region, we need to continue to redouble our efforts to build more housing and especially more purpose built rental.
The downtown core
The impacts of the pandemic are far reaching, the virus is changing the very fabric of our society. The rise of remote working for example, has created a new normal that is seems to be accelerating a move out of the city and towards the suburbs where real estate prices have followed suit. This trend is most noticeable in the hollowing out of Vancouver's Downtown Core. The overall office vacancy rate and sublet space in Greater Vancouver increased by 42% and 129.4% respectively, over the last year.
Changes were particularly pronounced in the very tight downtown Vancouver sublet market, which increased by a staggering 383% since Q3 2019. This is worrying news for Main Street businesses, especially those in the dense city core, who, the longer the pandemic goes on will struggle to return to pre-COVID levels. While these numbers are eye-popping it is important to note that by some estimates Vancouver still has the lowest office vacancy rate in North America.
Looking forward
So how do we emerge from the economic crisis and rebuild our region in the wake of COVID-19?
We need to build more housing. We must also embrace Vancouver's role as an international destination and move to welcome the world in a way that is safe. Finally we need to do everything we can to support our people. Whether that's reducing the administrative burden to enable entrepreneurs to succeed or helping those who have lost their jobs to return to the workforce, we must redouble our efforts.
There's no doubt that 2021 will bring brighter days, but if we aspire to not only recover from the pandemic, but continue our drive to make Greater Vancouver the best place to live and work, then we need to redouble our efforts to combat a range of challenges, not just those posed by the pandemic.