

Addressing the Fiscal Setting
Balancing the public accounts is desirable at any level of government, and is a legislated requirement for municipalities in British Columbia. They have limited means to raise revenues, and therefore must practice fiscal prudence. The pressures of providing infrastructure and services for a growing city-region are substantial challenges with which local governments have to grapple. However, when costs exceed revenues, and when councils expand budgets, businesses and residents are burdened with higher tax bills to cover expenditures. When aggregated over time and around the municipalities making up Greater Vancouver, it adds to the region's reputation as a high-cost place in which to do business and live.
| Indicator | Description | Ranking (2018) | Ranking (2016) |
|---|---|---|---|
| KPMG Total Tax Index | The index is designed to compare the total tax burden faced by companies in each city. | A 4/14 | A 3/12 |
| Marginal Effective Rate of Tax | This is the tax rate on capital investment. A high marginal effective tax rate on capital investment makes a region less attractive to corporate investment, reducing economic growth. | D 17/17 | C 10/17 |
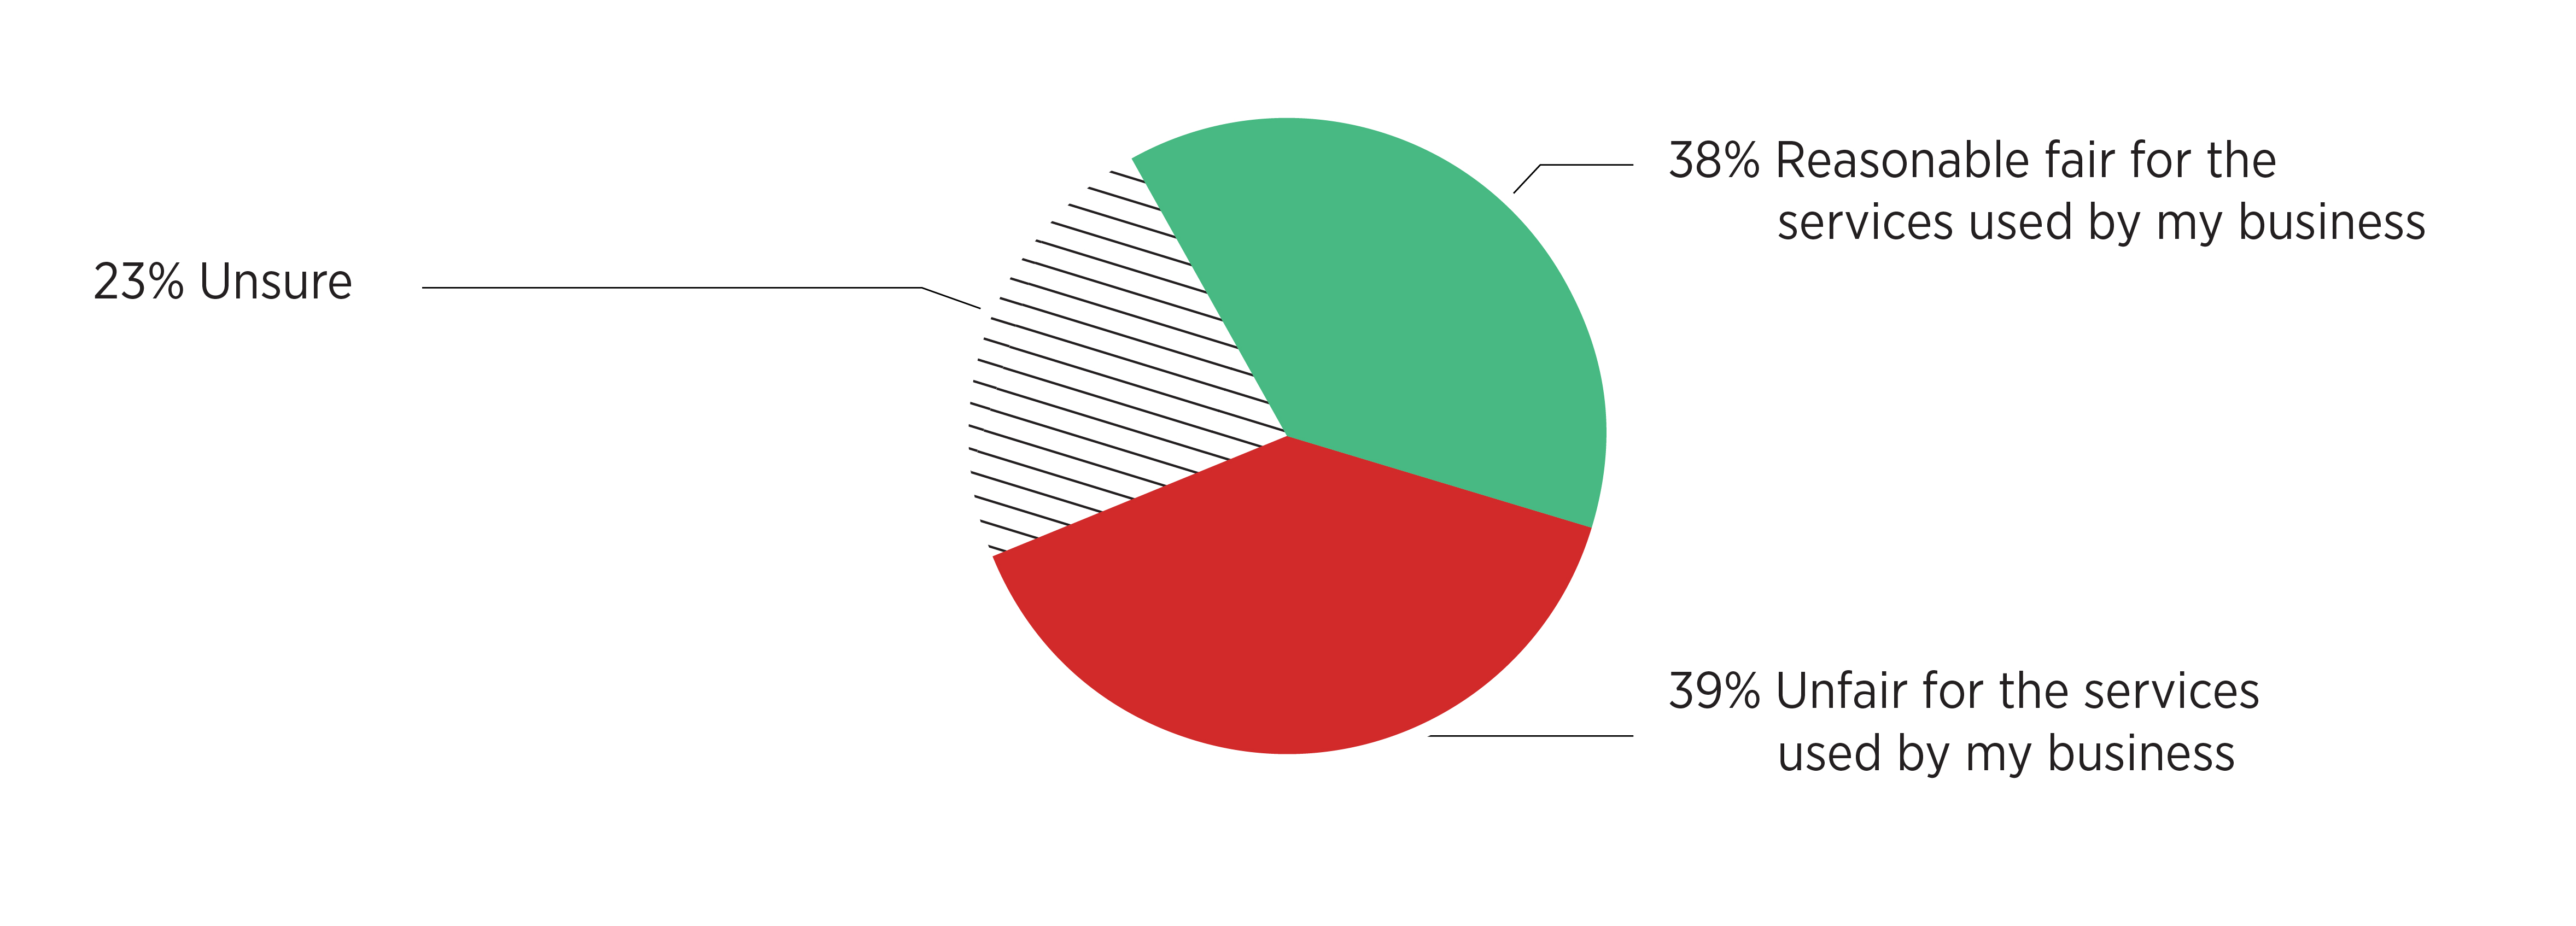
SURVEY: How would you describe the local government tax burden for your business over the past four years?
Commercial and Residential Property Tax
A notable imbalance has persisted for decades between commercial and residential property taxes. Businesses operating around the Greater Vancouver region are wary of the increasing burden. In the City of Vancouver, the 2017 ratio for the relative tax burden between commercial and residential properties is 4.87. In 2016 the ratio was 4.38. This is an 11.2% increase. (The higher the ratio, the greater the local tax burden placed on businesses). Despite property taxes in Vancouver having fallen between 2013 and 2017, the reduction in residential property taxes outpaces the reduction in business property taxes by 8%.
| Municipality (2017) | Residential | Commercial | Ratio |
|---|---|---|---|
| City of Vancouver | $2.55 | $12.44 | 4.87 |
| City of Burnaby | $2.99 | $13.60 | 4.55 |
| City of Coquitlam | $3.69 | $17.06 | 4.62 |
| City of Richmond | $3.01 | $11.72 | 3.89 |
| City of Surrey | $3.46 | $12.44 | 3.59 |
| Average | 4.30 | ||
Recommendations
- Deploy innovative tools to address the imbalance between municipalities' spending responsibilities and their ability to raise revenue, some of which are suggested in the Greater Vancouver Economic Scorecard 2018 Special Lens, in the Conference Board of Canada's full report;
- Establish a stepped approach to reducing the imbalance between residential and business property taxes.
Responsible Spending by Local Governments
As a general guideline, municipalities should keep spending in line with inflation and population growth. Higher spending by municipalities requires increases in taxes and fees, which are disproportionately borne by businesses.
Per capita municipality taxes relative to inflation and population growth vary widely across the province. The City of Surrey, the second most populous municipality in B.C. has the lowest municipal taxes across the province, whereas the District of West Vancouver, has some of the highest taxes with a much smaller population.
Due to the diversity of municipalities across the region, per capita comparisons are limited. However, in some municipalities property taxes have outpaced inflation. As average incomes follow inflation closely, municipal property taxes are disproportionately affecting household incomes across the region.
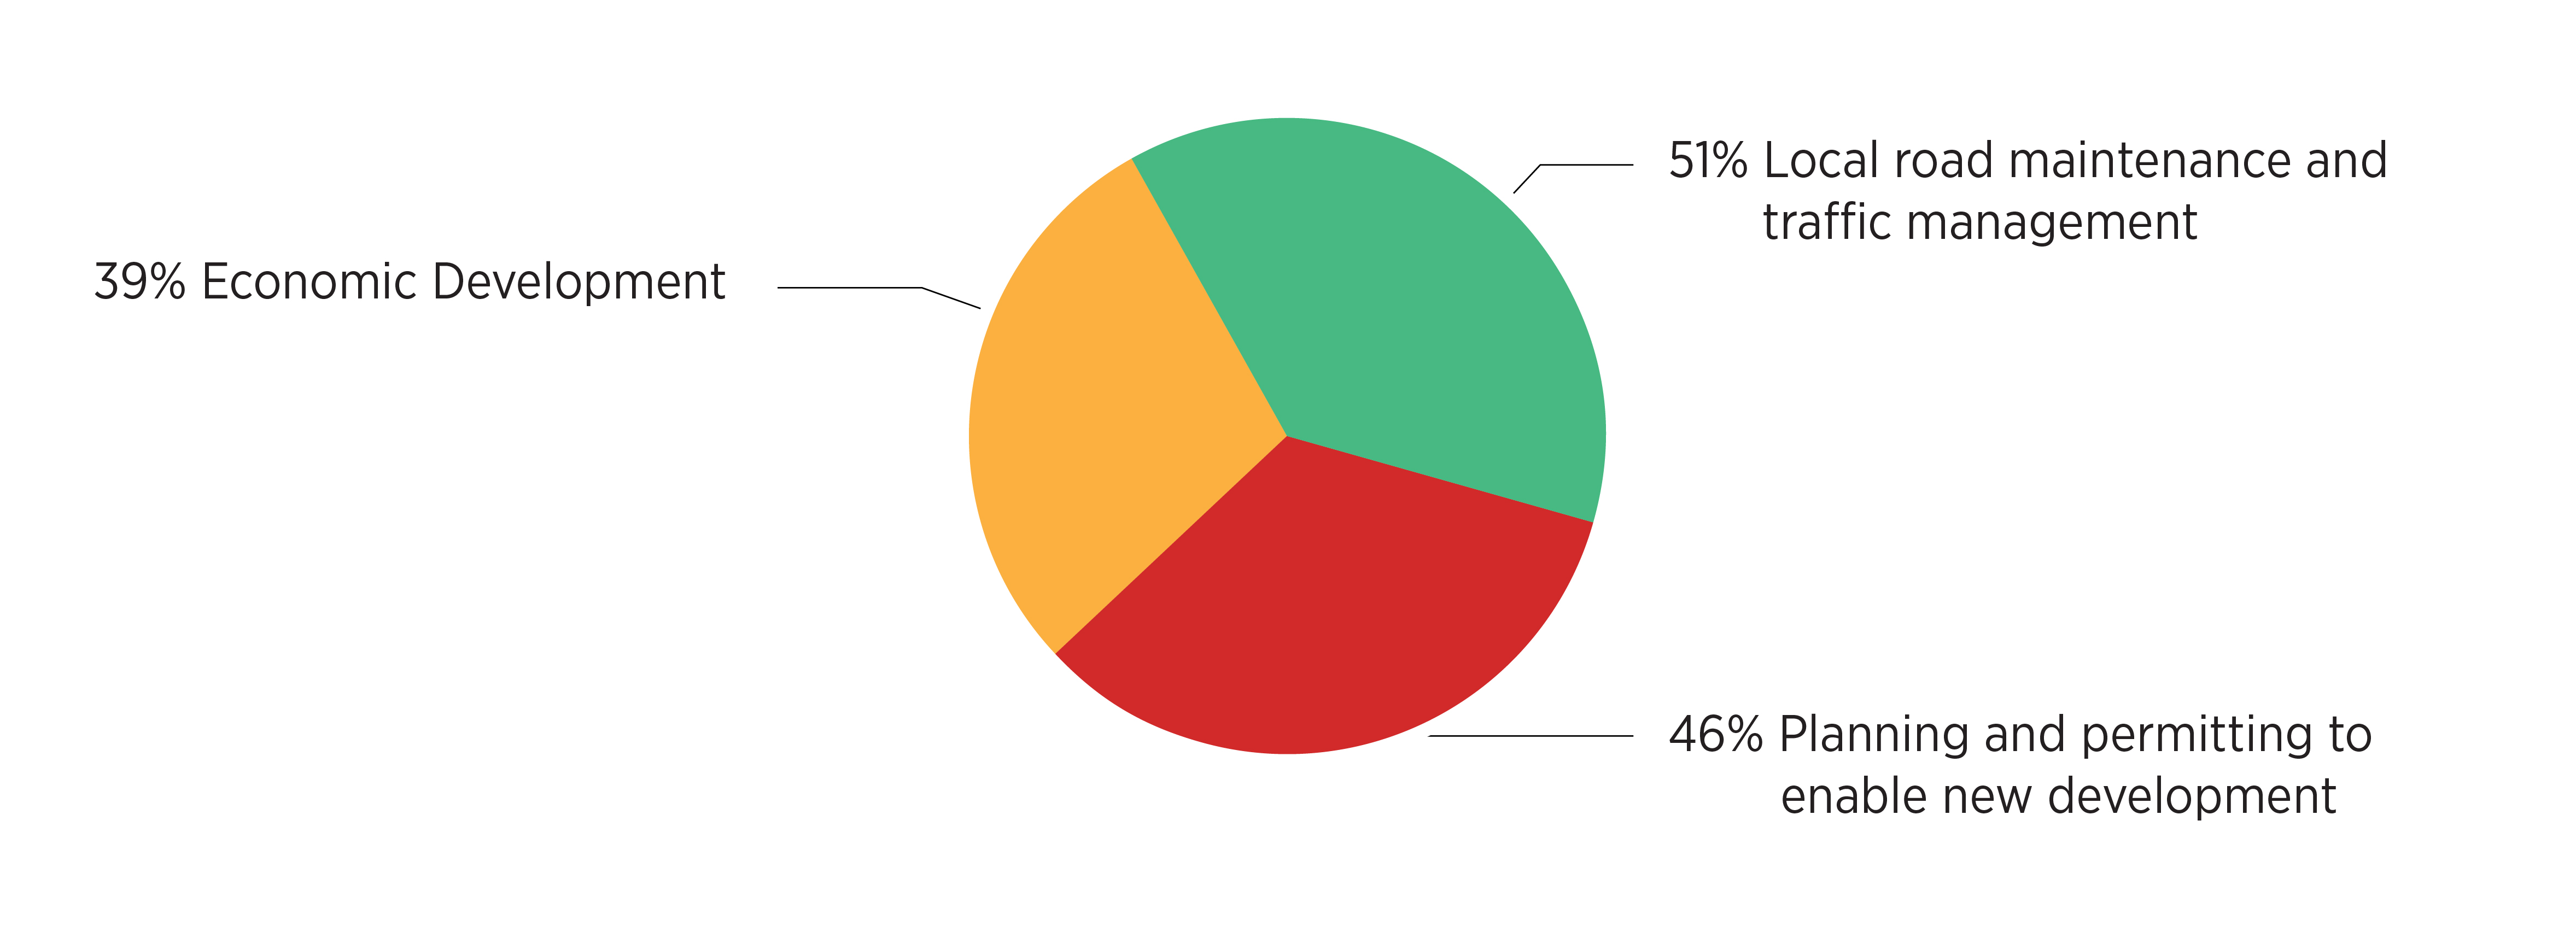
SURVEY: In terms of munciple government spending, what do you believe are the top 3 priorities for investment?
Recommendation
- Keep municipal tax increases in line with the rate of inflation and population growth.